In this article I will show you how to get the data visualisation solution Grafana to work with clean HTTPS on Ubuntu 18.04. As alwaysI recommend not running the service natively on your server but rather to run it in a VM.
Installation
Simply follow along the instructions of the official guide on the Grafana website.
LetsEncrypt
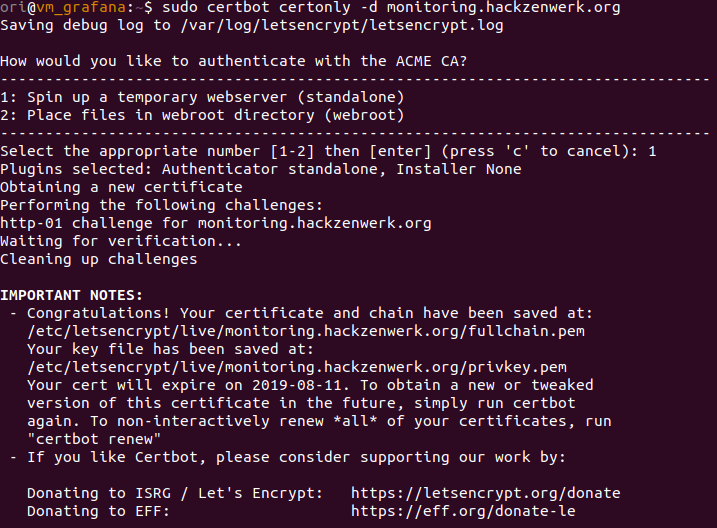
To secure our webserver with valid SSL certificates we generate an certificate using LetsEncrypt Ubuntu comes with certbot installed nativley.
sudo certbot certonly -d your.website

Write down the fullchain.pem and privkey.pem path. You will later put that into the grafana.ini configuration file.
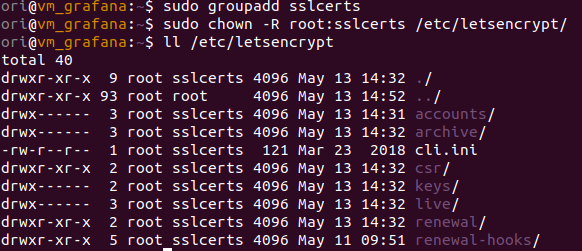
Before we do that, we have to make sure grafana can access these certificates. To do that we create a new group.
sudo groupadd sslcerts
/etc/letsencrypt is owned by the user root and the group root. We will change the group ownership recursivley to sslcerts.
user chown -R root:sslcerts /etc/letsencrypt/

Now we will add the user grafana (added when installing grafana) to this grop.
sudo usermod -G sslcerts -a grafana
Now we will have to adjust the permissions of /etc/letsencrypt/live and /etc/letsencrypt/archive
sudo chmod 755 /etc/letsencrypt/live sudo chmod 755 /etc/letsencrypt/archive
Editing the configfile /etc/grafana/grafana.ini
You will have to change the following lines:
30 [server] 31 # Protocol (http, https, socket) 32 protocol = https
37 # The http port to use 38 http_port = 443
40 # The public facing domain name used to access grafana from a browser 41 domain = your.grafana.url
47 # The full public facing url you use in browser, used for redirects and emails 48 # If you use reverse proxy and sub path specify full url (with sub path) 49 root_url = https://your.grafana.url
60 # https certs & key file 61 cert_file = /etc/letsencrypt/live/your.grafana.url/fullchain.pem 62 cert_key = /etc/letsencrypt/live/your.grafana.url/privkey.pem
Empowering Grafana to bind 443
The grafana service is not running as root. This is why in the default configuration a ein highport is beeing used for the webserver.
But we want to use 443…
To do this without granting grafana super user, we explicitly allow it to bind ports below 1024 using setcap. sudo setcap 'cap_net_bind_service=+ep' /usr/sbin/grafana-server
Further read: https://wiki.apache.org/httpd/NonRootPortBinding https://wiki.archlinux.org/index.php/Capabilities
Now, finally, restart the grafana service.
sudo systemctl restart grafana-server.service
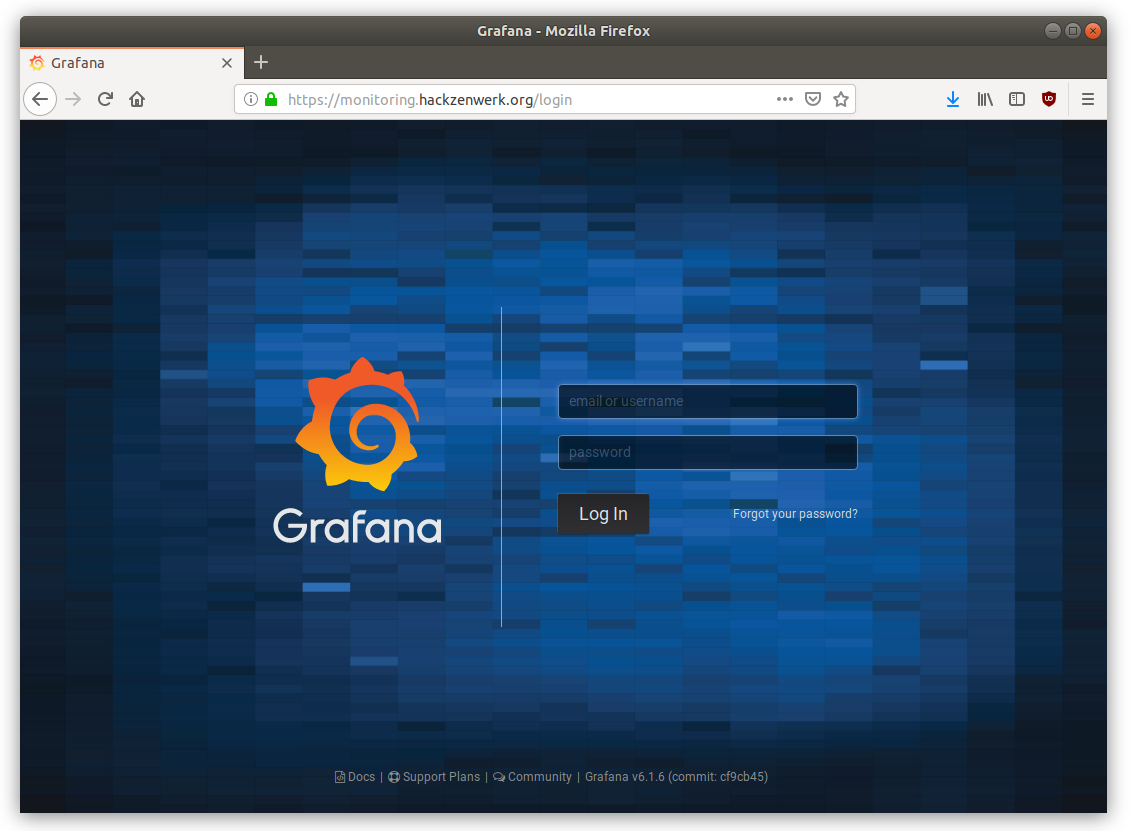
If you have done everything right, a clean HTTPS should be greeting you. If it does not work, a look into the logfile can be quite helpful.
sudo tail -f /var/log/grafana/grafana.log

At this webinterface you can now login using admin admin. You will be asked to change that password on the first login.
Now you can carry on using this guid: https://grafana.com/docs/guides/getting_started/
Cheers, Ori